Testing the unified neutral theory of biogeography
Download the Nature paper
Download the supplementary information
This work was recently featured in Trends In Ecology and Evolution's "Research Focus" section in a piece by Sean Nee and Graham Stone (TREE 2003 18(9):433-34)
The unified neutral theory of biogeography (UNTB) has probable polarized large scale ecologists more than any idea
since MacArthur & Wilson's Theory of Island Biogeography. It makes a very strong statement that most of what ecologists
have studied for the last 100 years is unimportant in what ecologists care most about (structuring communities and
controlling biodiversity).
To date, a few tests have been performed of the UNTB, but none of its central assumption that the Zero Sum Multinomial
distribution is the best description of species abundances. I test this under the following paradigm. I suggest that
the following suggests a sequence of progressively stronger tests:
- The curve fits the data well from an "eyeball" point of view (i.e. human perception)
- The curve fits the data well according to some objective measure such as r2 or c2.
- The curve fits the data better than the appropriate null hypothesis by some objective measure.
- The curve is statistically significantly better than the appropriate null hypothesis (i.e. we can reject the null).
- The curve is statistically significantly better than the appropriate null hypothesis after penalization for extra fitted (free) parameters.
In Hubbell's recent book, only level 1 of testing is achieved. I test the ZSM at level 4. Using 100 routes from
the North American Breeding Bird survey, I fit both the lognormal and ZSM disTRibutions. I then compare which fits
better using a 8 different measures of goodness of fit. Not only does the ZSM fail to reject the null hypothesis of the
lognormal (level 4), it fails to perform better even a majority of the time (level 3). This seriously calls into question
the validity of the UNTB and its rejection of traditional community ecology.
Here are a few summary results
Table 1 - Goodness of fit for four different measures, 3 based on R2 and one based on
Kolmogorv-Smirnov. You can see That the lognormal beats the ZSM both on average and for the vast majority
(80-100%) of the individual cases
|
| R2
| R2MC
| R2Corr
| K
|
| LogNorm
| 1.00 (0.99,1.00)
| 0.98 (0.93,0.99)
| 0.98 (0.96,1.00)
| 0.10 (0.06,0.15)
|
| ZSMult
| 0.99 (0.95,1.00)
| 0.89 (0.67,0.97)
| 0.97 (0.92,0.99)
| 0.26 (0.20,0.37)
|
| %ZSM beats LN
| 4%
| 4%
| 23%
| 0%
|
Table 2 - Goodness of fit but for measures based on χ2 statistics.
Four diffent types of binning are used. The results are similar to above.
Cases where the ZSM produced infinite (x/0) or undefined (0/0) χ2 are removed, biasing results towards the ZSM. The number of remaining
ZSM cases is reported in the 3rd row.
|
| X2
| X2
| X2 bin
| X2 <bins
|
| Lognoraml (all cases)
| 19.7 (5.2,63.7)
| 8.97 (2.71,17.60)
| 11.1 (3.6,22.9)
| 8.64 (1.27,34.74)
|
| ZSM avg (good cases)
| 20.65937
| 23.96379
| 19.04134
| 12.85472
|
| # ZSM good
| 30
| 100
| 95
| 87
|
| % where ZSM beats LN
| 6.67%
| 0%
| 3.16%
| 3.45%
|
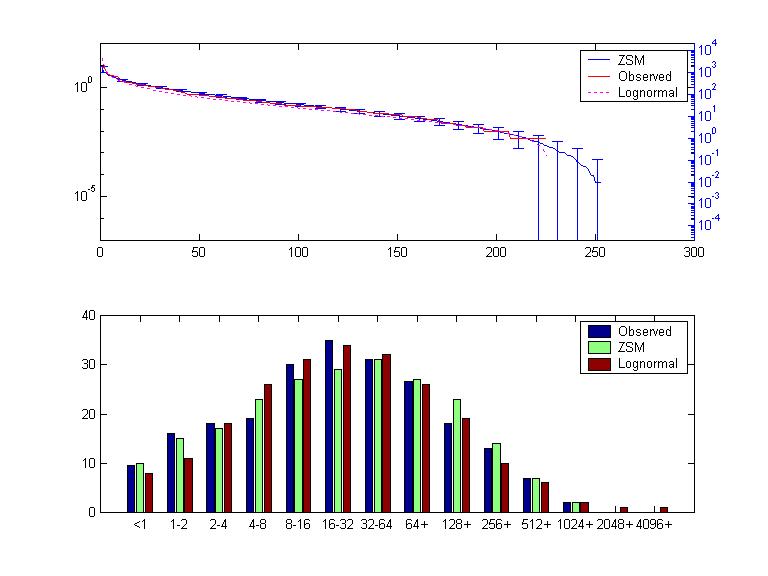
(Click on image to see enlargement)
I also fitted the ZSM to a version of the BCI tree dataset (Condit et al 2002). Although this does not allow
for replication or testing at level 4, the lognormal beat the ZSM on all eight measures of goodness of fit.
I am making the source code for fitting the ZSM freely available.
Several intersting scientific shortcomings of the ZSM were found in implementing the fitting code. These include the fact that
- It may take 1,000-10,000 years to reach equilibrium in a local community
- The equilibrium is fairly noisy (# of species varies by about 10%)
- There is an undocumented parameter used in the fitting (# of species observed)
Brian McGill's home page